Build your first map
In this guide you build a small map that answers a real question: What is the data-center share of global electricity in 2030?
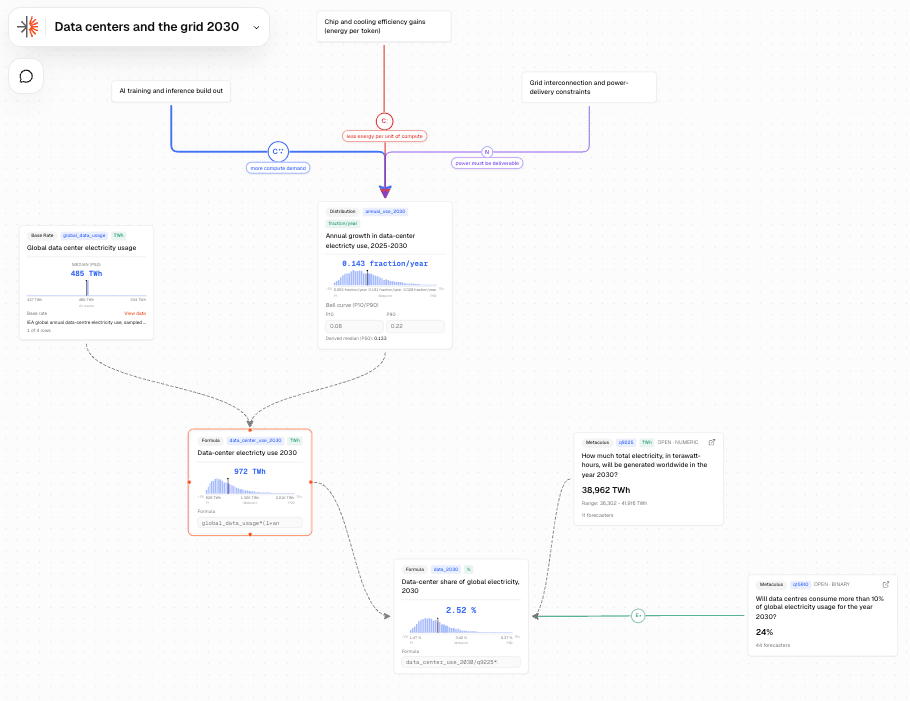
The plan
Split the question into a side you model and a side you borrow.
- Demand, which you model. How much electricity data centers will use in 2030. That depends on where we start and how fast usage grows, and the growth rate is where the judgment lives.
- Supply, which you borrow. How much electricity the world will generate in 2030. Metaculus has an open forecast on exactly this, so you import it.
- The outcome. Demand divided by supply gives the share. A second Metaculus question gives you something to compare against.
Create the project
From Projects, choose New project and call it Data centers and the grid 2030. New projects start Private; you can share it later.
Start from data: the baseline
Place a Base Rate node and title it Global data center electricity usage, with the unit TWh.
A Base Rate holds historical rows rather than a number you assert, which is what you want when you are anchoring on a published series. The rows come from Pull Historical Data on the node: ask for the IEA's annual estimates of global data-center electricity use. Review what comes back before you accept it; nothing is written until you do.
The pull returns several years, not necessarily consecutive ones. Open View data, tick the latest year alone — 2025 here — and choose Apply selection. You want a starting level, not an average of the years usage grew through, and selecting is how a Base Rate is narrowed: rows themselves are never edited by hand.
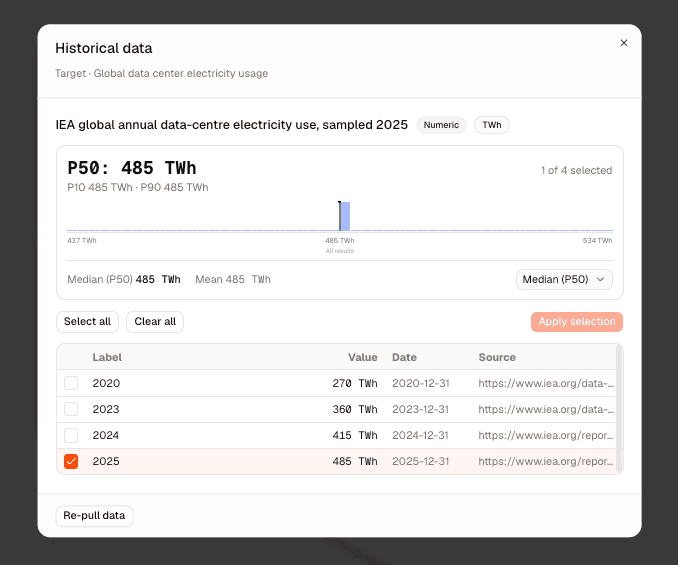
Set Headline value to Median (P50); with one row selected the card reads that year's figure, about 485 TWh.
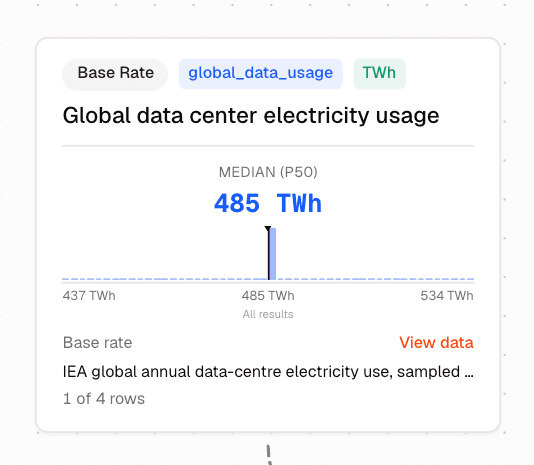
Note which year you kept, and note the reference code on the card — global_data_usage here,
though yours may differ. You will need both in a formula shortly.
Rows arrive through the assistant
Pulling historical data runs an agent task, so it draws on your AI credits and returns whatever it can find. If the rows differ from the ones here, the shape of the map is unchanged — your numbers will simply be your own.
Say what you believe: the growth rate
Place a Distribution node, titled Annual growth in data-center electricity use, 2025–2030, and set these in the inspector:
- Unit:
fraction/year - Shape: Bell curve (P10/P90)
- P10:
0.08 - P90:
0.22
Enter fractions rather than percentages: 0.08 means 8% a year. Radiant derives the median from the
two percentiles and shows it under them — 0.133 for this pair.
This is the node the map hinges on. Everyone agrees usage is growing; the disagreement is about how fast. A 10th-to-90th range of 8–22% a year says you would be mildly surprised outside that band, and Radiant fills in the rest of the curve.
These are the numbers used here, not the right answer. If your own reading of the evidence puts the range higher or narrower, enter your percentiles instead. Everything downstream follows from this node, so the rest of the guide works with whatever you believe.
Keep the reasoning on the map
The range you just entered did not come from nowhere. Place three plain Nodes — title and notes, no value — and write two or three lines in each:
- AI training and inference build-out
- Chip and cooling efficiency gains (energy per token)
- Grid interconnection and power-delivery constraints
Connect the drivers to the growth node
Drag from each driver into the growth distribution, then set each connection in the inspector:
| From | Relationship | Label | Impact | Strength |
|---|---|---|---|---|
| AI build-out | Causal | more compute demand | + | Large |
| Efficiency gains | Causal | less energy per unit of compute | − | Med |
| Grid constraints | Necessary | power must be deliverable | n/a | n/a |
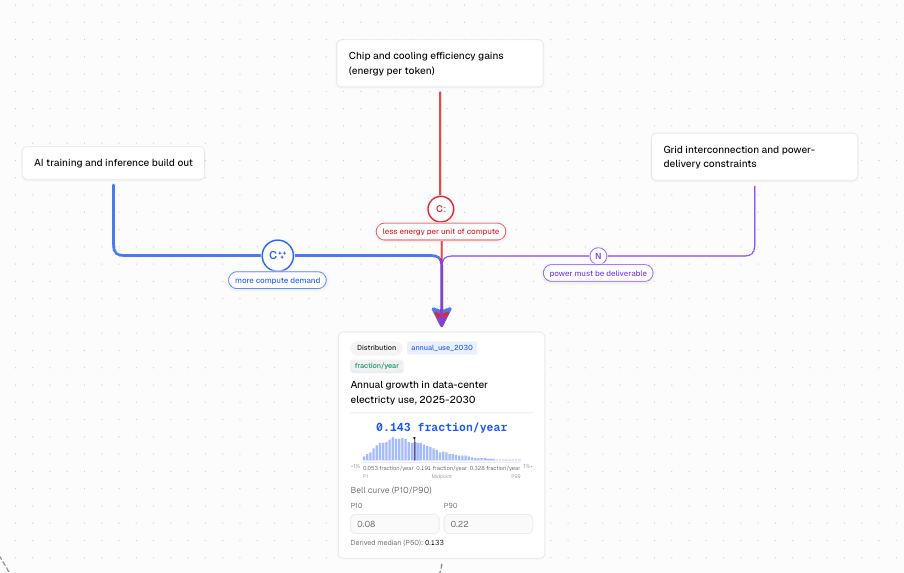
The first two are both causal and push in opposite directions. The third is a different kind of claim: grid capacity does not drive demand, it is a precondition for it, so Necessary is the honest label. Necessary connections carry no impact or strength — see Edge labels.
Connections never change your numbers
Drawing, retyping, or deleting a connection has no effect on a forecast or a simulation. Calculations come from node values and formulas alone. A connection is how you show a colleague why the growth range is 8–22%, and give them a specific place to disagree.
Compute demand in 2030
Place a Formula node, titled Data-center electricity use 2030, with the unit TWh:
global_data_usage * (1 + annual_use_2030)^5The formula is compound growth. Each year, usage is what it was the year before plus the growth
rate, so one year is × (1 + rate) and several years multiply that factor together: ^ is how many
times. The exponent is therefore the number of years between your baseline and 2030. The baseline
here is 2025, so it is ^5. If your pull returned a different latest year, count from that one
instead — a 2024 baseline is ^6.
Substitute the codes your own baseline and growth nodes received.
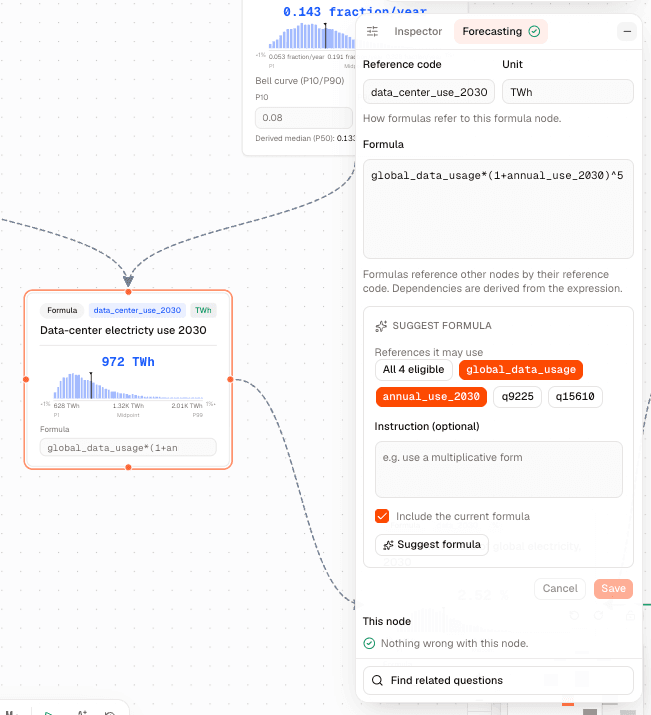
A narrow spike instead means the exponent did not take. Check that the formula ends in ^5.
Borrow supply from Metaculus
Place a Metaculus Question node and search for How much total electricity, in terawatt-hours,
will be generated worldwide in the year 2030?, or paste the post ID 9225.
The community forecast arrives as a whole distribution rather than a single number: about 38,962 TWh, ranging roughly 36,300–41,900.
Compute the share
Place a second Formula node, titled Data-center share of global electricity, 2030, with the
unit %:
data_center_use_2030 / q9225 * 100An imported question's code is q followed by its post ID, so q9225 names the node you just
placed. Connect the demand formula and the Metaculus node into it.
The preview shows a median around 2.5%, with a 1st-to-99th range of about 1.5% to 5.4%.
Run it
Press Run simulation. Radiant samples the whole map thousands of times, drawing from every node's uncertainty, and saves the result so you can return to it.
The histogram on the share node is the map's answer. Look at how much of it sits above 10%: with these inputs, almost none.
Compare with the community
Place one more Metaculus Question node: Will data centres consume more than 10% of global
electricity usage for the year 2030?, post ID 15610. The community sits at about 24%.
Connect it into the share formula as Evidential, labeled community outside view. It does not enter the arithmetic. It is there so the comparison is visible on the map.
Two answers that disagree
Your map says the 10% threshold is very unlikely. The community says roughly one in four.
You can see exactly what would have to be true for the community to be right. With a 485 TWh baseline and a 39,000 TWh denominator, crossing 10% needs about 3,900 TWh of data-center demand in 2030 — sustained growth above 50% a year, well outside your 8–22% range.
So the disagreement lives in one node, and the conversation to have is about that node: is the AI build-out driver bigger than you allowed for, or is the community over-extrapolating from the last two years? Whichever way you land, you now know what you would need to learn to change your mind.
Where to go from here
- Sharpen the growth node. Replace the single distribution with a short chain: AI capacity build-out in GW, utilization, efficiency trend. The drivers you kept as notes can become quantities one at a time, as evidence allows.
- Invite a collaborator. Share the project and ask them to state their own view on the growth node. Radiant folds predictions from several people into one value.
- Predict on Metaculus. If the map changed your view, take it back to question 15610.
If something did not work
- New project says you’ve reached your project limit. A new account can own three projects, and the count beside the Projects heading shows how many you have. Delete one you no longer need, or choose Contact us and tell us what you’re building so we can raise the limit.
- A formula reports
Formula node references unknown code "…". The code it names belongs to no node. Read the codes off the cards, or from the inspector, and match them exactly. - The demand node is a narrow spike near 490 TWh. The growth is not compounding. Check the
formula ends in
^5, and that the percentiles are fractions —0.08, not8. - The share reads 0.025 rather than 2.5. Multiply by 100 in the formula, and set the unit to
%. - Run simulation is disabled. Something the output depends on is blocked, and the button names the reason. See Troubleshooting forecasts.
- Nothing is editable. You have view access to this project rather than edit access. See Sharing a project.