Distributions
The three families a Distribution node can take, what each asks for, and why the bell curve derives its own median.
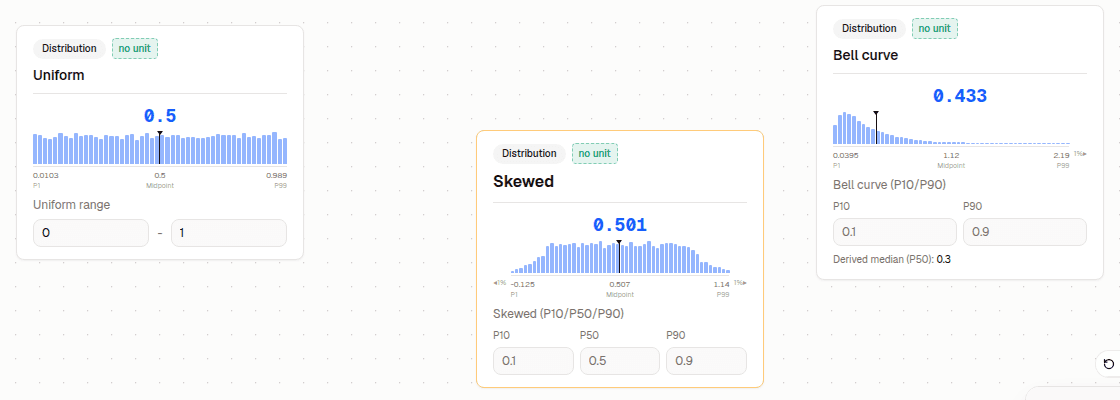
A Distribution node holds a range instead of a single number. You pick a family, and the family decides which parameters it asks you for. Both are set in the inspector, under the node's title, with the distribution they draw shown beneath them. The card shows the same distribution.
| Family | Asks for | Use when |
|---|---|---|
| Uniform (min/max) | Min, Max | Anything in the range is as likely as anything else |
| Skewed (P10/P50/P90) | P10, P50, P90 | You have a central estimate and lopsided uncertainty |
| Bell curve (P10/P90) | P10, P90 | You have a range and no reason to skew it |
Percentiles, briefly
A P10 of 0.55 means: you think there is a 10% chance the true value is below 0.55. A P90 of 0.75 means a 10% chance it is above 0.75. Together they say you would be mildly surprised outside that band — and unsurprised anywhere inside it.
P50 is the median: as likely to be above as below.
Uniform
Min and max, and every value between them equally likely.
Min must be less than max. Radiant reports needs min to be less than max rather than quietly swapping them, because a reversed range is usually a typo rather than an intention.
Uniform reports its exact mean
A Uniform card states the mean its parameters define — Uniform(0.4, 0.6) reads 0.5, not a
sampled approximation of it. Other families round sampled values to the run's precision.
Skewed
P10, P50 and P90, in that order. They must be non-decreasing: Radiant reports needs P10 <= P50 <= P90 if they are not.
Use it when your uncertainty is lopsided — a project that might finish slightly early or catastrophically late is not symmetric.
Bell curve
P10 and P90 only. Two percentiles fix a bell curve completely, so Radiant derives the median rather than asking you for it — and shows the derived value beside your inputs as a read-only figure.
How it derives depends on the range:
- A range that stays on one side of zero is fitted as a log-normal, so a positive quantity stays positive. The median is the geometric midpoint. This reads as right-skewed once you look at the values, which is usually what you want for a quantity that cannot go below zero.
- A range that reaches zero is fitted as a plain logistic, and the median is the arithmetic midpoint. This is the only branch that is symmetric on the value scale.
Why a bell curve can look lopsided
A log-normal is symmetric in log space, not in value space. A P10 of 10 and a P90 of 1000 gives a median of 100 — the geometric midpoint — not 505. That is the fit doing its job, not a bug.
Changing family
Different families cannot be combined into one value, so predictions are stated in the node's family. Changing the family of a node people have predicted on asks first: it says how many predictions it would delete and how many belong to other people, and deletes them once you confirm. Undo straight after brings them back.
What a distribution feeds
Everything downstream samples from it. A formula reading a Distribution node draws a different value each pass of a simulation, which is how uncertainty in one input becomes a range in the result rather than disappearing at the first multiplication.
See Running a simulation.